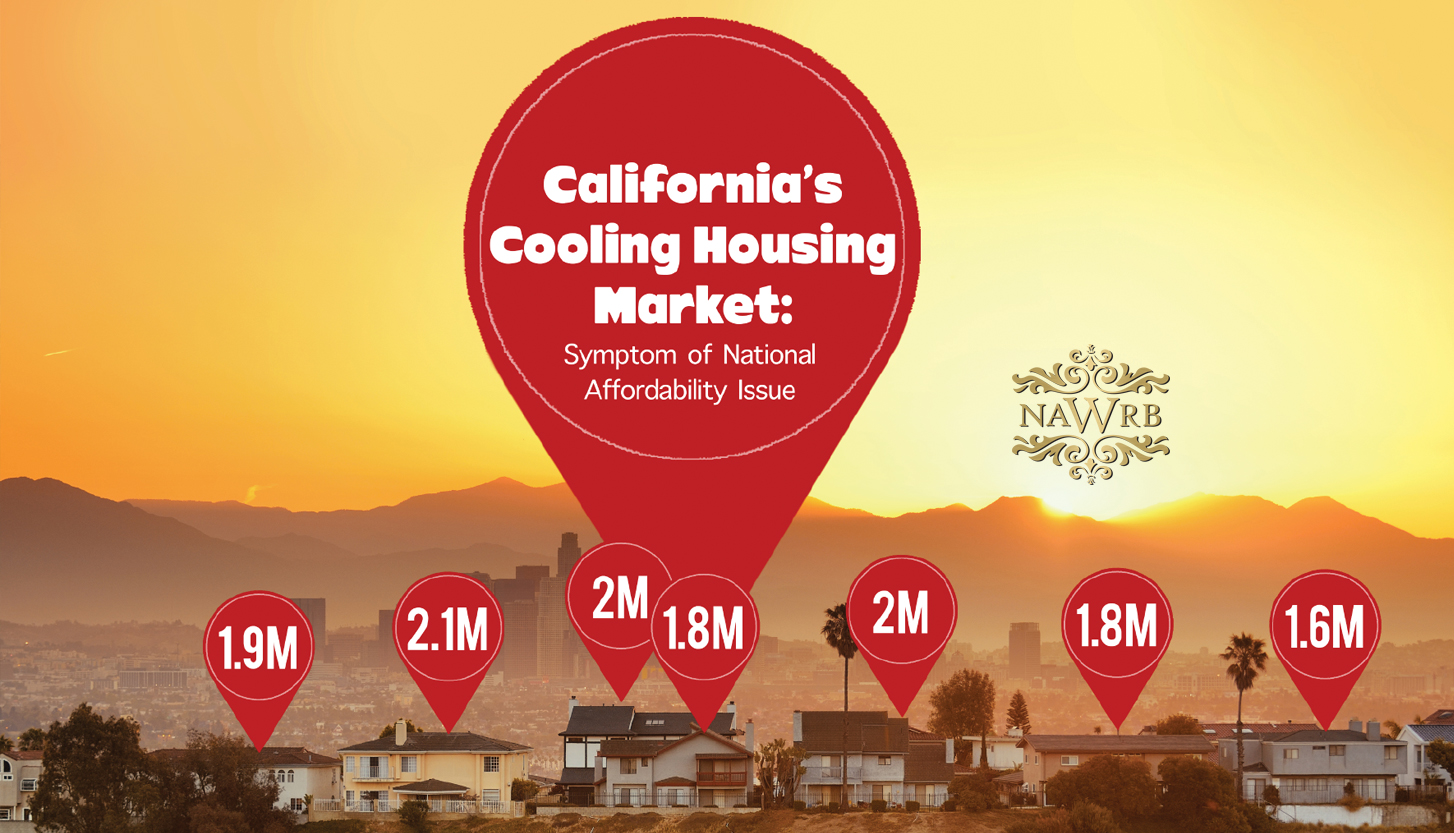
The latest UCLA Anderson Forecast of California’s economic and housing market reports that housing will continue to cool into the year 2020 despite current job growth and strong economy. The economists attribute the weakening to falling home prices in major markets and decreased demand.
Economists anticipate the demand for housing will decrease in California’s major markets even though recent trends indicate the state’s overall economic strength, including improvements in the job market.
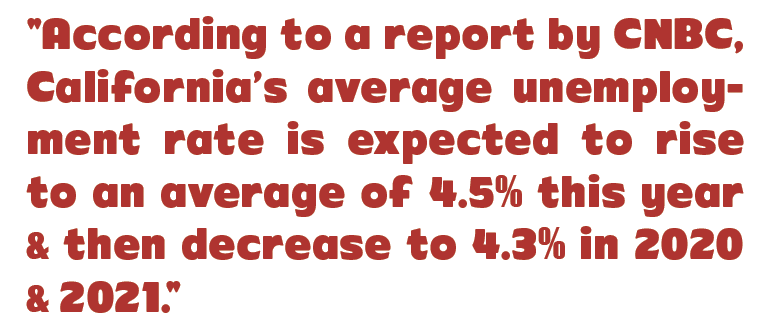
According to a report by CNBC, California’s average unemployment rate is expected to rise to an average of 4.5 percent this year and then decrease to 4.3 percent in 2020 and 2021. Also, the state has added the highest number of construction jobs, amounting to 28,500, in the past year.
At the same time, falling home prices in markets have been “widespread and substantial”, states Jerry Nickelsburg, Director of UCLA’s Anderson School of Management forecast. This includes areas other than San Francisco, Los Angeles and Silicon Valley. Even the Central Valley of California has been impacted by the cooling housing market as home sales have declined by more than 10 percent.
In Southern California and the San Francisco Bay Area, CoreLogic reports that home sales fell to an 11-year low in January 2019. Sales have been falling on a year-over-year basis for the past eight months in the Bay Area and for the last six months in Southern California.
The problem of declining home sales is compounded by the state’s housing shortage and decrease in housing starts. “Home prices are falling in California as is the level of building,” writes Nickelsburg forecast. One possible reason for this is that “higher mortgage interest rates are depressing prices but not the underlying demand.”
California’s housing market slowdown will likely affect Governor Gavin Newson’s plan to build 3.5 million new housing units in the state by the year 2025, which would require 500,000 homes to be built per year. The current rate at which new housing, with 120,000 homes built in 2018, is only a fraction of this goal. Overall, these trends are signs of weaker economic growth in the near future.
 Low Housing Starts and Affordability are National Issues
According to a report by the U.S. Department of Commerce, the number of homes that were being built as of December 2018 was at its lowest level in the more than two years. The decrease in housing starts during this period indicates that developers are anticipating fewer new houses that will be sold this year. Building permits increased by just 0.3 percent, suggesting that growth in new housing will continue to be sluggish in the future.
The Commerce Department states that housing starts fell 11.2 percent in December from the previous month, resulting in a seasonally adjusted rate of 1.08 million. Pace of construction has not been this slow since September of 2016.
While housing starts have plummeted 10.2 percent in the past 12 months, the decline that occurred in December is attributed to a stall in single-family houses and apartment buildings. Higher home prices have created an affordability problem for potential renters and buyers.
According to CNBC, home prices have steadily increased faster than wages, and their is a tight selection of available homes listed at $250,000 or less. The decrease in home sales has influenced builders to limit construction projects, but there is hope that falling 30-year mortgage rates, which increased by nearly 5 percent last year, will bolster homebuying in 2019.
U.S. Metro Cities Investing the Most in New Housing
Increased demand for new housing in a specific geographic area can be an indicator of job growth and a prospering economy, while a halt in demand in new housing might signify an economic slowdown. Using data from the U.S. Census Bureau Building Permit Survey, researchers from Construction Coverage identified the metropolitan areas in the nation that are investing the most funds in new housing.
Cities Investing the Most in New Housing
1. Austin – Round Rock, TX
- 137.1 new housing units (per 10K residents)
2. North Port-Sarasota-Bradenton, FL
- 131.9 new housing units
3. Raleigh, NC
- 125.9 new housing units
4. Cape Coral-Fort Myers, FL
- 124.1 new housing units
5. Boise City, ID
- 122.3 new housing units
6. Provo-Orem, UT
- 118.7 new housing units
7. Orlando-Kissimmee-Sanford, FL
- 113.1 new housing units
8. Durham-Chapel Hill, NC
- 95.7 new housing units
9. Nashville-Davidson-Murfreesboro-Franklin, TN
- 95.0 new housing units
10. Charlotte-Concord-Gastonia, NC-SC
- 93.6 new housing units
For each metropolitan area, the company calculated the number of building permits that were issued per capita for the last 12 months, and then compared it to the national average. Notable trends from the recent trailing 12 months of data show that builders constructed approximately 40 new residential units per 10,000 residents. Moreover, in the largest metros, the range in per capita residential construction varied from below one unit to more than 130 units per 10,000 residents.
According to the report, there is a strong correlation between new housing development with population and employment growth. Therefore, areas that have the most per capita residential construction projects are more likely to have high employment and population growth.
Other noteworthy relations include a positive correlation between home values on the Zillow Home Price Index and investment in residential real estate projects. However, changes in median earnings were not correlated with new housing investment.
Overall, low levels of housing development can be a greater symptom of economic challenges such as lack of employment opportunities and slow population growth. However, it appears that rising home prices are pushing potential homebuyers out of the market, and the lack of home sales are decreasing construction projects.
It is in America’s best interest to develop affordable housing for its citizens so they can attain jobs, earn money for short-term and long-term financial wealth and contribute to the economy at the statewide and national level.

 Login
Login

